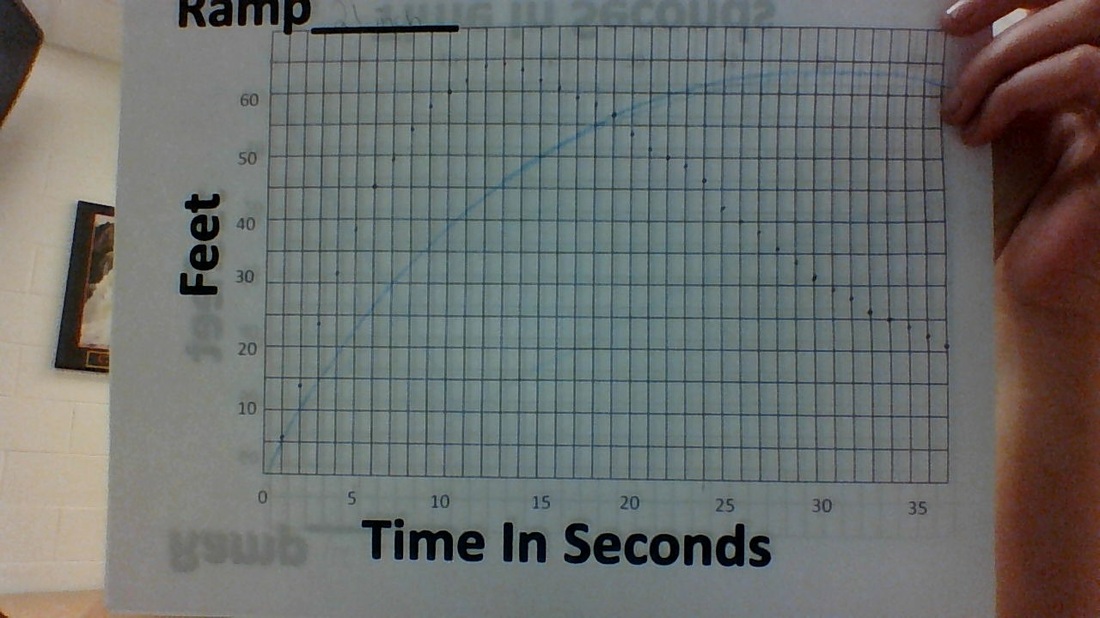
A. (21 inch Ramp) My prediction wasn't really close but it had the same concept. I believe this is because i was able to under stand that it would be increasing then decreasing but i wasn't sure how to calculate the rate at which this would be true.
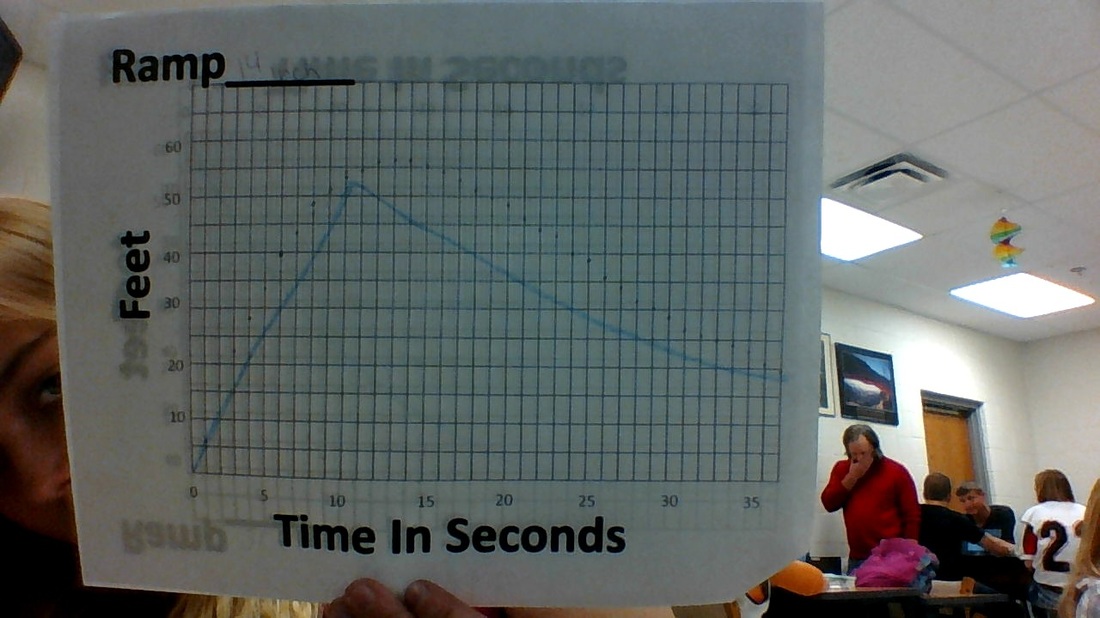
(14 inch Ramp) My prediction was a lot closer but was to pointed at the Maximum, because i was once again off at the rate in which it was moving
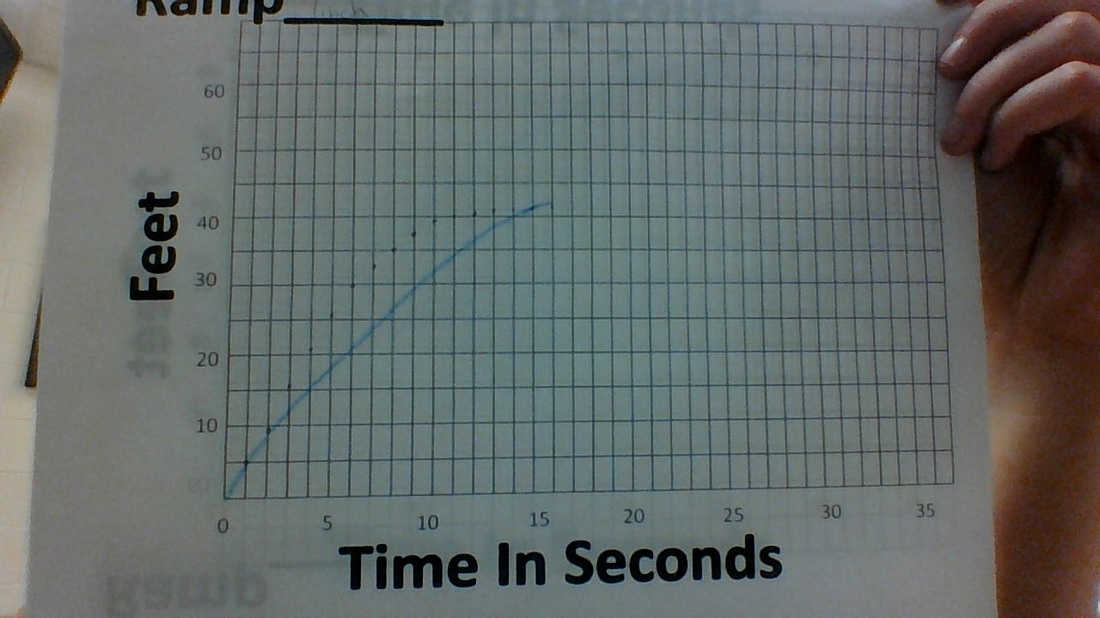
(7 inch ramp) My prediction was the best out of the three on this one. I was closer on getting the rate at which it increased/decreased.
B. ( 21 inch ramp) Domain: [0,35) Range: [0, 65)
( 14 inch ramp) Domain: [0,37) Range: [0, 58)
( 7 inch ramp) Domain: [0, 16) Range: [0, 42)
C. Zeros: all the same start; Maximum: decreases with each graph, because the highs at which the skateboard starts gets lower; Minimum: Stays relatively the same other then the 7 inch graph which stops at 16 seconds in.
D. The Graph raised the fastest when the skateboard went down the ramp because it was gaining speed. The graph starts to decrease when it climbs the slant in the driveway because all its momentum is lost then gained again but forces it backwards.
(14 inch Ramp) My prediction was a lot closer but was to pointed at the Maximum, because i was once again off at the rate in which it was moving
(7 inch ramp) My prediction was the best out of the three on this one. I was closer on getting the rate at which it increased/decreased.
B. ( 21 inch ramp) Domain: [0,35) Range: [0, 65)
( 14 inch ramp) Domain: [0,37) Range: [0, 58)
( 7 inch ramp) Domain: [0, 16) Range: [0, 42)
C. Zeros: all the same start; Maximum: decreases with each graph, because the highs at which the skateboard starts gets lower; Minimum: Stays relatively the same other then the 7 inch graph which stops at 16 seconds in.
D. The Graph raised the fastest when the skateboard went down the ramp because it was gaining speed. The graph starts to decrease when it climbs the slant in the driveway because all its momentum is lost then gained again but forces it backwards.
 RSS Feed
